Starting a dashboard for openHAB data
In this post I’ll set up the software needed to store data from openHAB and display it on a dashboard. I’ll use a z-wave thermostat I have already set up on my network, and I’ll add Grafana and InfluxDB.
Set up the containers
Lately I’ve been trying to compartmentalize things, so I want to run Grafana and InfluxDB in Docker. There are options that run them all in the same container, but I liked nicolargo/docker-influxdb-grafana which is essentially just a simple docker-compose file that uses base (read: maintained) images.
$ git checkout https://github.com/nicolargo/docker-influxdb-grafana.git
In docker-compose.yml there are two volumes keys that link out to the
disk. I modified those paths, but otherwise didn’t make any changes. By
setting up the volumes here, I’ll have persistent storage beyond restarts.
When I first tried to run the containers, the Grafana container failed with permission problems. Grafana mentions some permissions changes in a different context, but following these steps fixed my issues also:
$ docker run -ti --user root --volume "/data/docker/grafana/data:/var/lib/grafana" --entrypoint bash grafana/grafana:latest

# then within the container, run:

$ chown -R root:root /etc/grafana
$ chmod -R a+r /etc/grafana
$ chown -R grafana:grafana /var/lib/grafana
$ chown -R grafana:grafana /usr/share/grafana
After that the containers fired right up:
$ docker-compose up -d
Set up InfluxDB
InfluxDB is running now, but I need to add the new user and database. First I
opened a shell with docker exec -it influxdb influx and then made the
changes:
> create database openhab
> create user openhab with password "openhab"
> grant all on openhab to openhab
Getting data into InfluxDB
As with the rest of this walkthrough, someone already did the hard parts, so I really just need to install a plugin for openHAB.
- Load the PaperUI in openHAB
- Click Add-ons in the left menu
- Click Persistence in the top menu
- Click Install next to InfluxDB Persistence
Next I’ll SSH into the openHAB box and edit or create two configuration files. Copies of mine are below.
# /etc/openhab2/services/influxdb.cfg

# This is the URL for influxdb.  Don't forget the port.
url=http://192.168.1.2:8086
user=openhab
password=openhab
db=openhab
# /etc/openhab2/persistence/influxdb.persist

Strategies {
    everyMinute : "0 * * * * ?"
    everyHour   : "0 0 * * * ?"
    everyDay    : "0 0 0 * * ?"

    default = everyChange
}

Items {
    *   : strategy = everyChange, everyHour
}
I have an * in my Items declaration because I want to send everything to
InfluxDB. That can be changed to specific Items or Groups to narrow down what
is sent if desired.
With those files in place, openHAB will send data to InfluxDB every time something changes and every hour. I had to restart openHAB for the changes to take effect:
$ sudo systemctl restart openhab2
Make sure data is flowing
Look at the logs for InfluxDB by running docker-compose logs influxdb.
openHAB should have sent a hello:
influxdb [httpd] 192.168.1.1 - - [02/Dec/2018:02:21:49 +0000] “GET /ping HTTP/1.1” 204 0 “-“ “okhttp/2.4.0”
Depending on how much activity there is in openHAB there may be other entries in the logs also. To double check inside InfluxDB itself try this:
$ docker exec -it influxdb influx

# And then inside the influxdb client
> use openhab
> show measurements
A list of all the measurements sent so far will display. select * from
somekey will dig into the data itself.
Set up Grafana
The Grafana interface is on port 3000 by default and the credentials are
admin/admin. On first login Grafana shows a wizard interface, so this moves
along pretty quickly. The new Data Source is the InfluxDB type, probably with
a URL of http://influxdb:8086. Docker-compose does the DNS for free here.
I’ll put a Graph panel on a new dashboard and click the title of it to edit. The metrics tab has the queries and since the data is already flowing in, the correctly named Keys appear in a dropdown when I’m editing them. The query can stay mostly as defaults, here is what mine looks like:
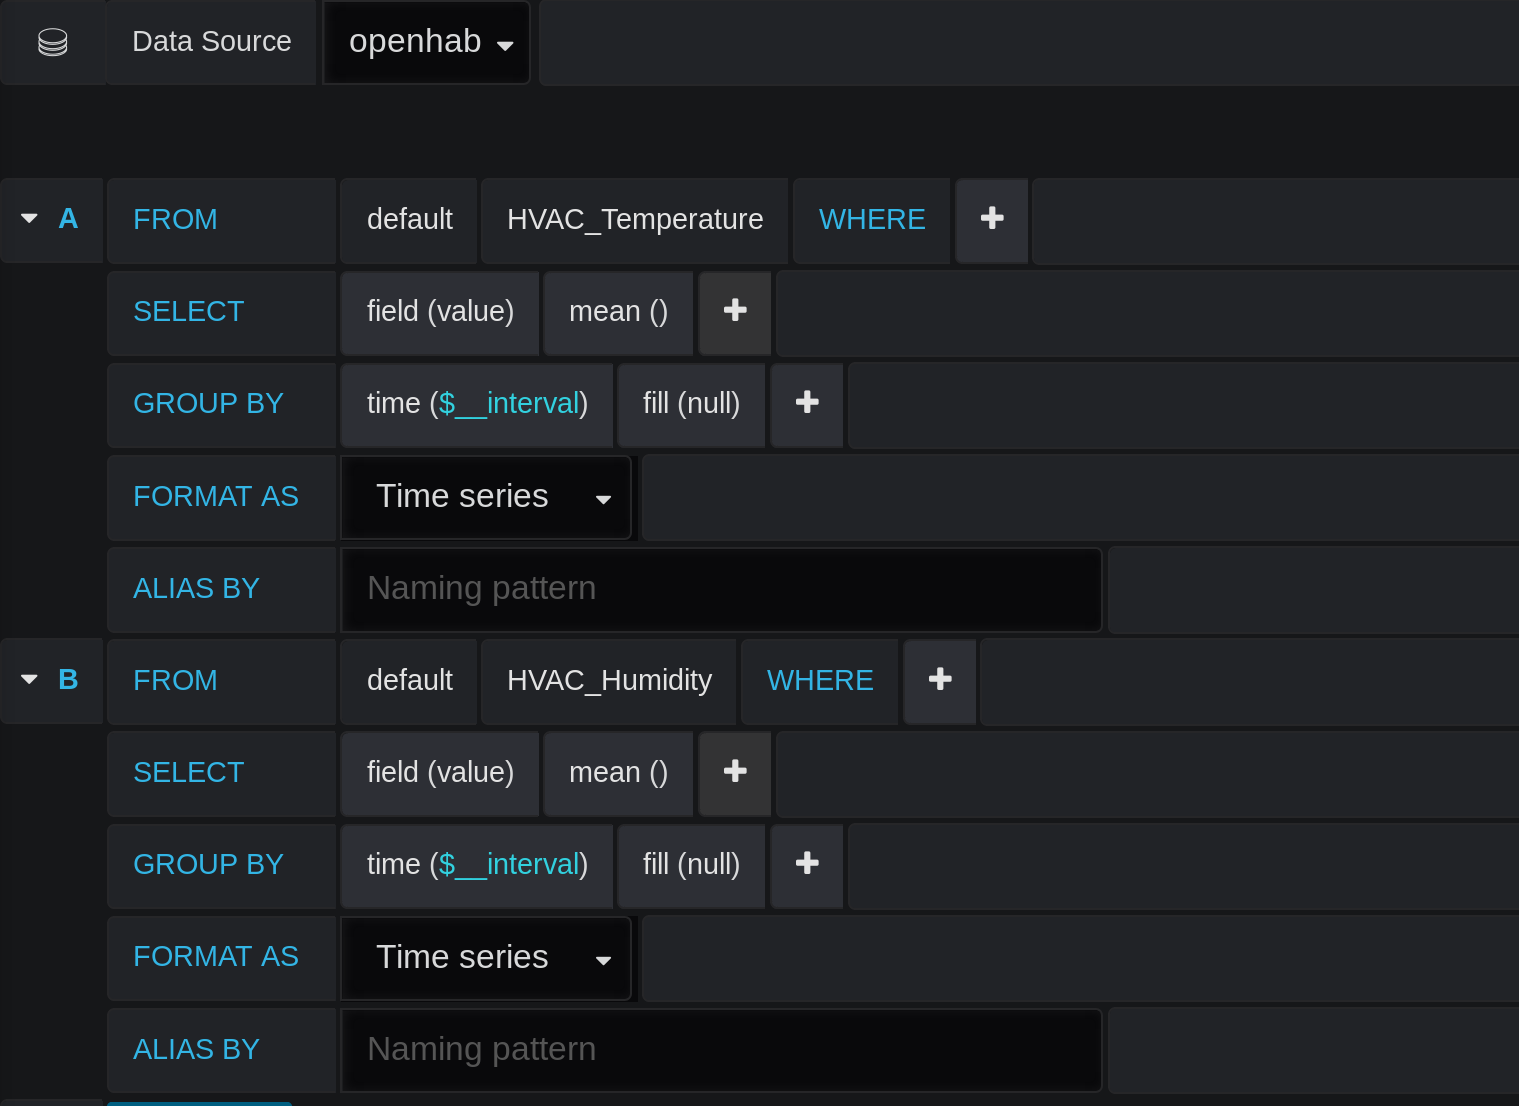
My Key names (eg. HVAC_Temperature) come from how I set the device up in openHAB.
The only other thing to change here is in the Display tab: I set the Null Value
to connected so I’ll have a nicely drawn line chart even though the
Temperature only changes periodically.
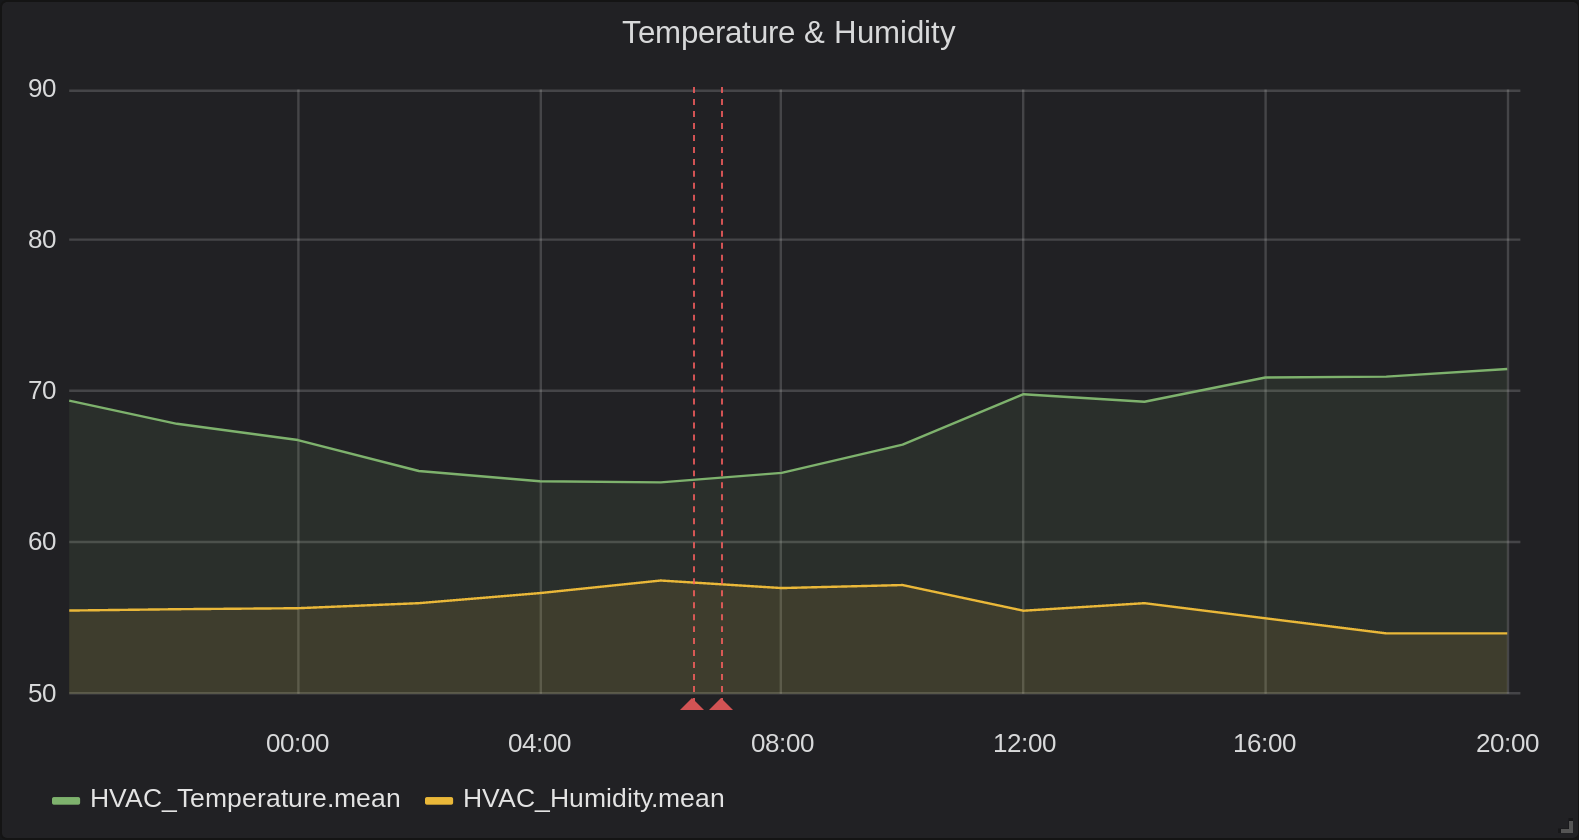
One more bit of fanciness
I have a wood stove that I use in winter, but if it gets below a certain temperature (depending on the time of day) I have my furnace kick on. I wanted to be able to see when my furnace was coming on, so I decided to make use of Grafana’s Annotations capability (the red vertical lines in the top image).
From within the dashboard I clicked the Settings Gear in the header (not the one on the left) and chose Annotations. From there I made a new Annotation with a custom query:
SELECT value from HVAC_Operating_State WHERE value=1 AND $timeFilter ORDER BY time ASC LIMIT 10
The AND $timeFilter is important. As before, mine is named
HVAC_Operating_State because that’s what I named the Item in openHAB when I
set it up.
And that’s it. Returning to the dashboard after 24 hours should show something like the graph at the top of this post.